View results
- Open the Promotion → Pay-per-click section.
- Filter campaigns by status, payment method, or period.
- To download the data, click More → Download report.
You can also view results in the detailed report or promotion analytics.
On the “Pay-per-click” page
-
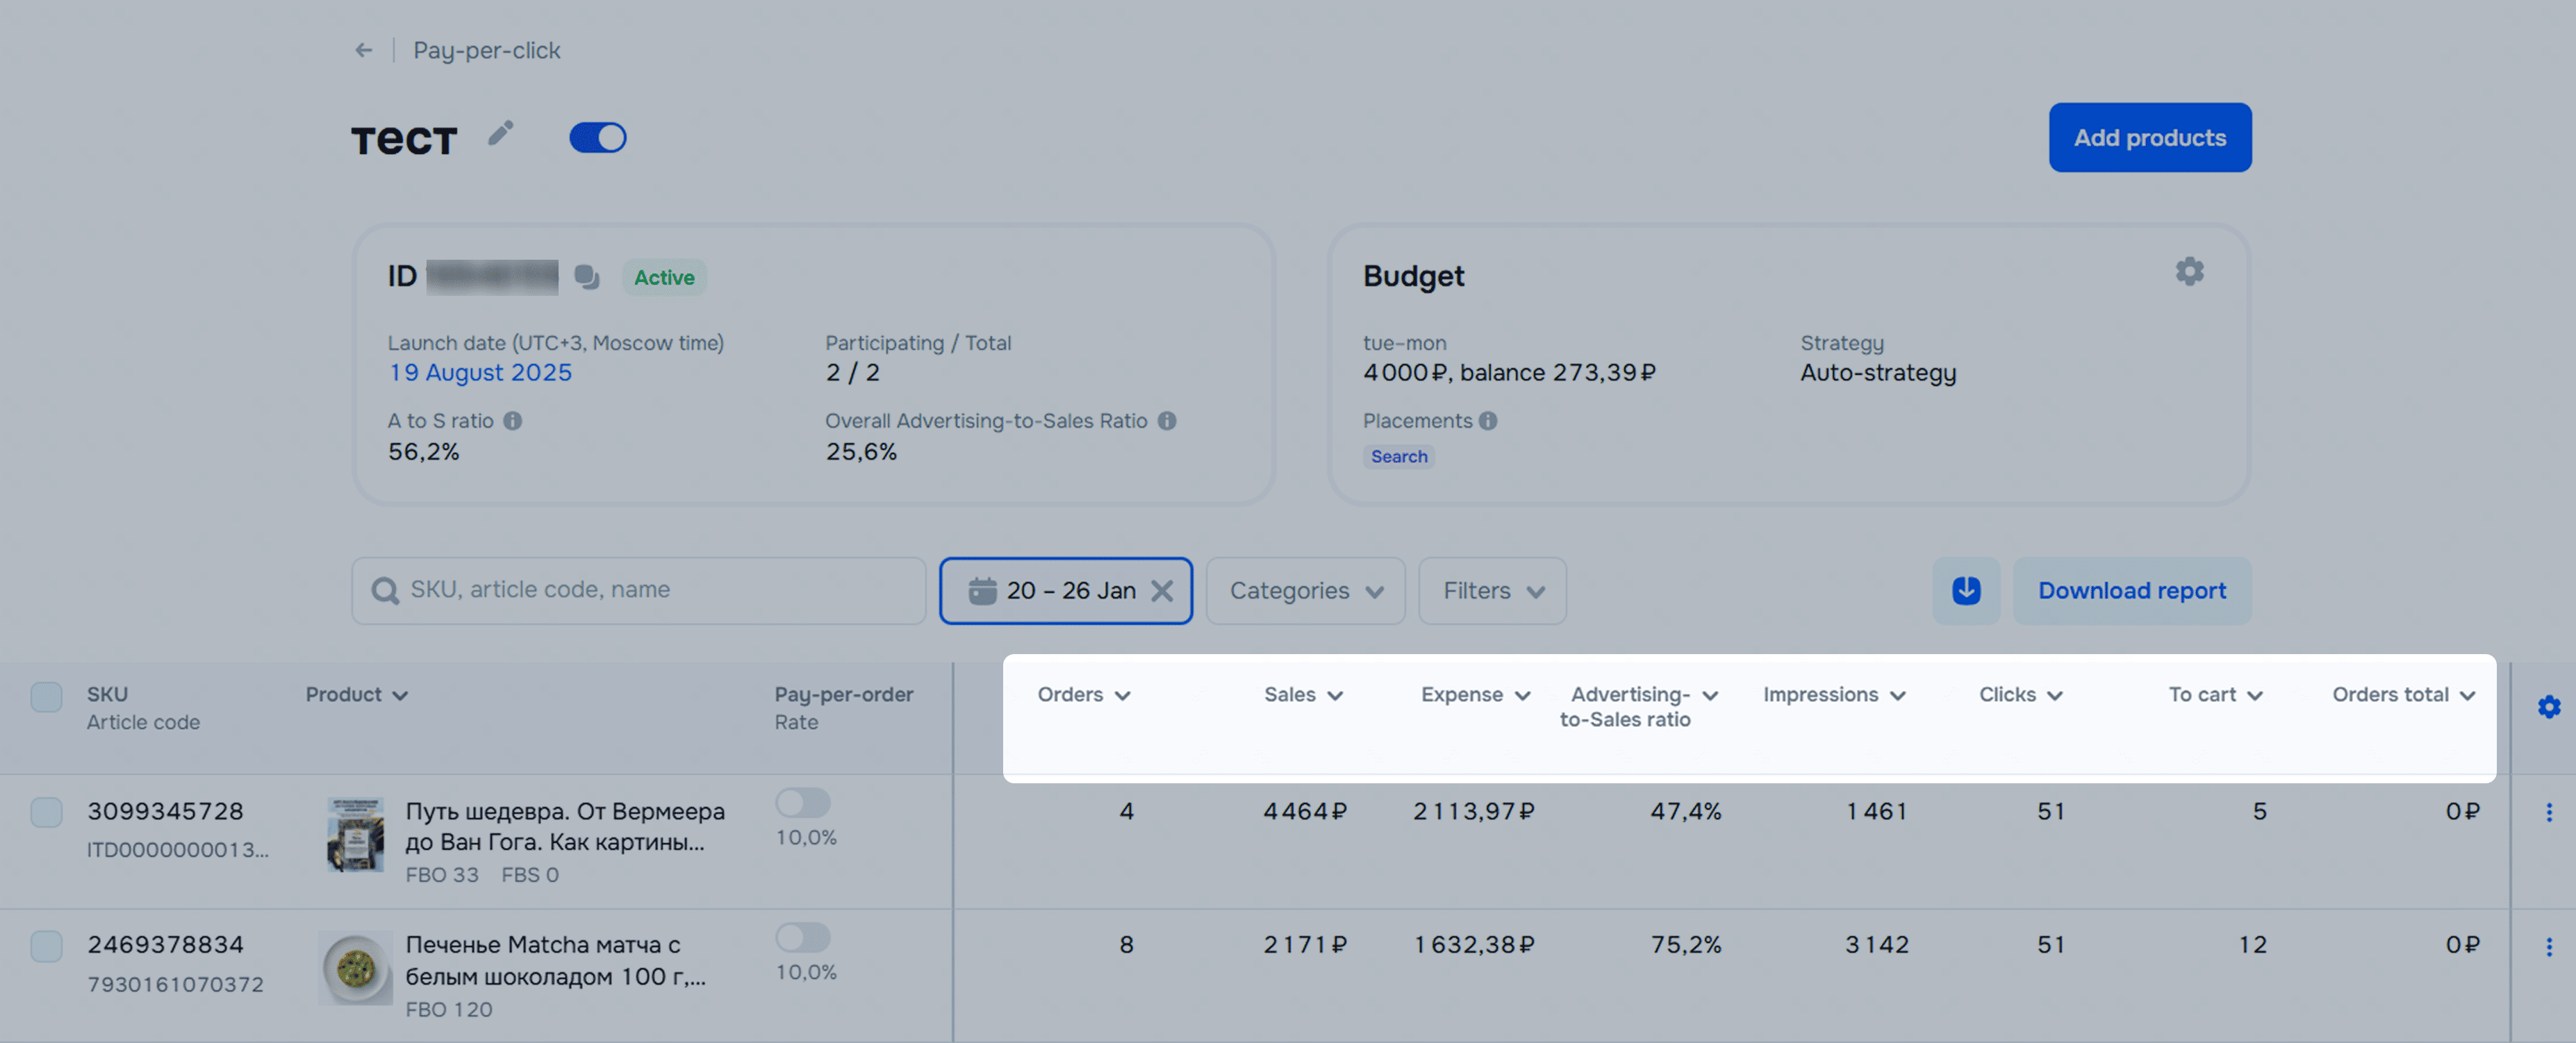
In the Promotion → Pay-per-click section, open the campaign.
-
Select the period for which you need product details.
If necessary, specify product categories or search for products by their article codes, SKUs, or names.
-
For each product, we show:
- Average cost per click: the average amount spent per click on the PDP in the promoted position.
- Orders: the number of orders you received due to the promotion tool.
- Sales: the sales amount of products and their models you sold with the promotion.
- Orders total: the total order amount with and without the promotion. We don’t take into account model sales.
- Expense: costs for product promotion and the percentage of costs for this particular product relative to the total campaign expenses.
- Advertising-to-sales ratio: the ratio of promotion expenses to the sales amount you got with the promotion, including sales of product models.
- Overall advertising-to-sales ratio: the ratio of promotion expenses to the total order amount, excluding models.
- Impressions: the number of times your product was shown in the selected placements.
- Clicks: the number of clicks, additions to cart or favorites for the promoted product.
- To cart: the number of additions to cart for the promoted product.
- CTR: the ratio of clicks to impressions.
- Date added: the date when the product was added to the campaign.
In the report
- Click Download statistics on the campaign page.
- Select the period and data grouping method: by days, weeks, or months.
- Click Download.
- Click
 to open the Ready reports section. There you can view daily reports.
- Click the file name to download it.
Metrics in the report:
- “Impressions”: the number of times your product was shown in the selected placements.
- “Clicks”: the number of clicks, additions to cart or favorites for the promoted product.
- “CTR”: the ratio of clicks to impressions.
- “To cart”: the number of additions to cart for the promoted product.
- “Average cost per click”: the average amount spent per click on the PDP in the promoted position.
- “Expense, ₽, including VAT”: costs for promoting products in the campaign.
- “Orders”: the number of orders you received thanks to the tool.
- “Sales”: the sales amount of products and their models you sold with the promotion.
- “Orders total”: the total order amount with and without the promotion. We don’t take into account model sales.
- “Model orders”: orders of a different variant of the promoted product. For example, you’re promoting a dress in size 42, and the customer bought the same dress in size 44.
- “Advertising-to-sales ratio”: the ratio of promotion expenses to the sales amount you got with the promotion, including sales of product models.
- “Overall advertising-to-sales ratio”: the ratio of promotion expenses to the total order amount, excluding models.
The Orders Total and Overall A to S Ratio metrics are displayed for campaigns created since January 16, 2026.
Orders considered in statistics
We include an order in the statistics if a customer orders a product or its models merged into one PDP within:
- 10 days after clicking on the promoted PDP;
- 30 days after adding the promoted product to cart or favorites.
Orders appear in the statistics only after the customer pays for them. Orders with postpayment are also counted.
If a customer cancels or returns a paid order, it remains in the statistics.
Example 1
You added a blue dress to the campaign, but the customer purchased a red dress
from the same PDP instead. When calculating the Sales and Advertising-to-sales ratio metrics,
we take into account the promoted product and its models.
You can view the number of orders and sales amount for models of a promoted product separately.
Learn more about viewing orders for promoted product models
Example 2
A customer clicked on your PDP promoted in recommendations and then closed the app.
Three days later, they found this product again and placed an order with payment upon receipt.
In another 15 days, the customer received and paid for the product.
At this moment the order appears in the statistics.
View orders for promoted product models
To view the data about the merged models of a promoted product:
- In the Promotion → Promotion analytics section:
- in the Views of data block, select the Products filter;
- click Download report and view the data on the “Union” tab.
- In the Promotion → Pay-per-click section, go to the campaign page, click Download report and view the “Model orders” column.
View the report on search queries
From September 1, 2025, you can view the search queries report only for campaigns where products are promoted in search.
- Go to Promotion → Pay-per-Click.
- Open the campaign and click Download Report → Search Queries Report. The document contains:
- search queries through which the customer found the PDP and clicked on it;
- the ratio of clicks to impressions.