Определили ваш договор
Он заключён с ООО «Интернет Решения». Если есть другой договор, сможете переключиться на него в боковом меню
On the main page of the app you can view your store statistics for the last 14 days. For example, sales schedule, competitive position, number of shipments, and their statuses.
You can see the sales schedule for the last 14 days. To view detailed information for the day, click on the day column.
You can view statistics on the number or cost of products sold. To see the number of products sold, click For the amount and select Pieces. The graph shows several metrics:
Ordered is the total number or cost of ordered products, not taking into account cancellations and refunds.
Delivered is the total number or cost of products delivered, not taking into account cancellations and refunds.
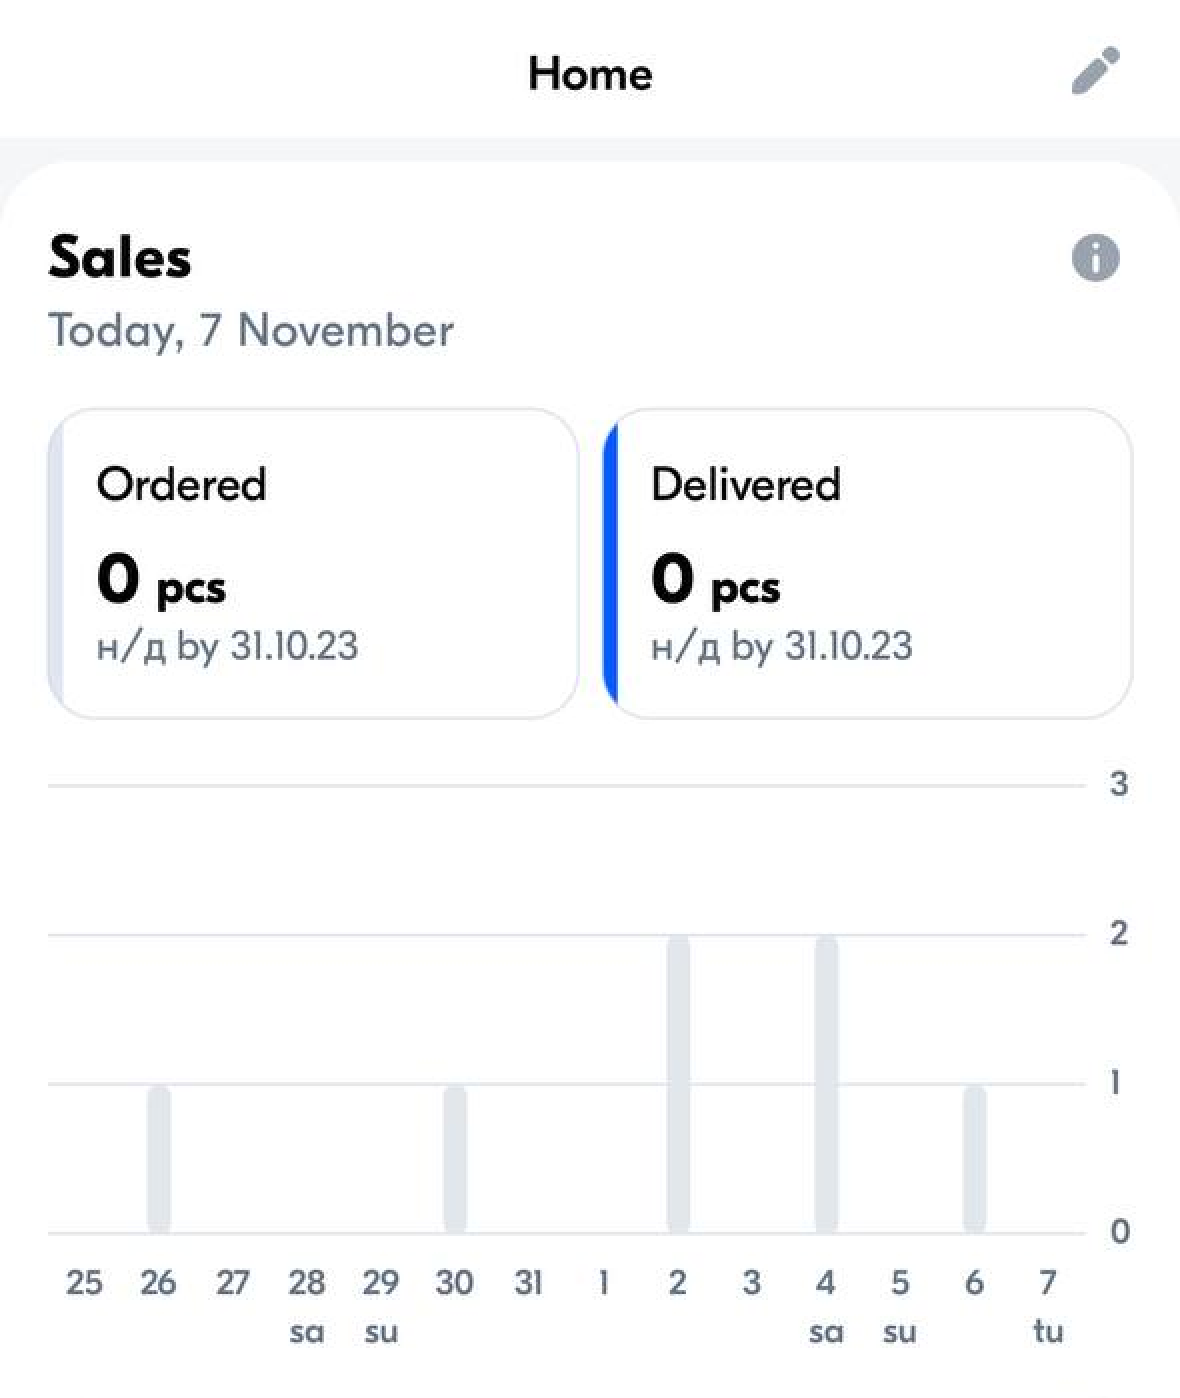
Both metrics are included in the data for the day the order was sent. For example, the customer orders a product on February 6, and you ship it on the 7, the graph shows data for February 7.
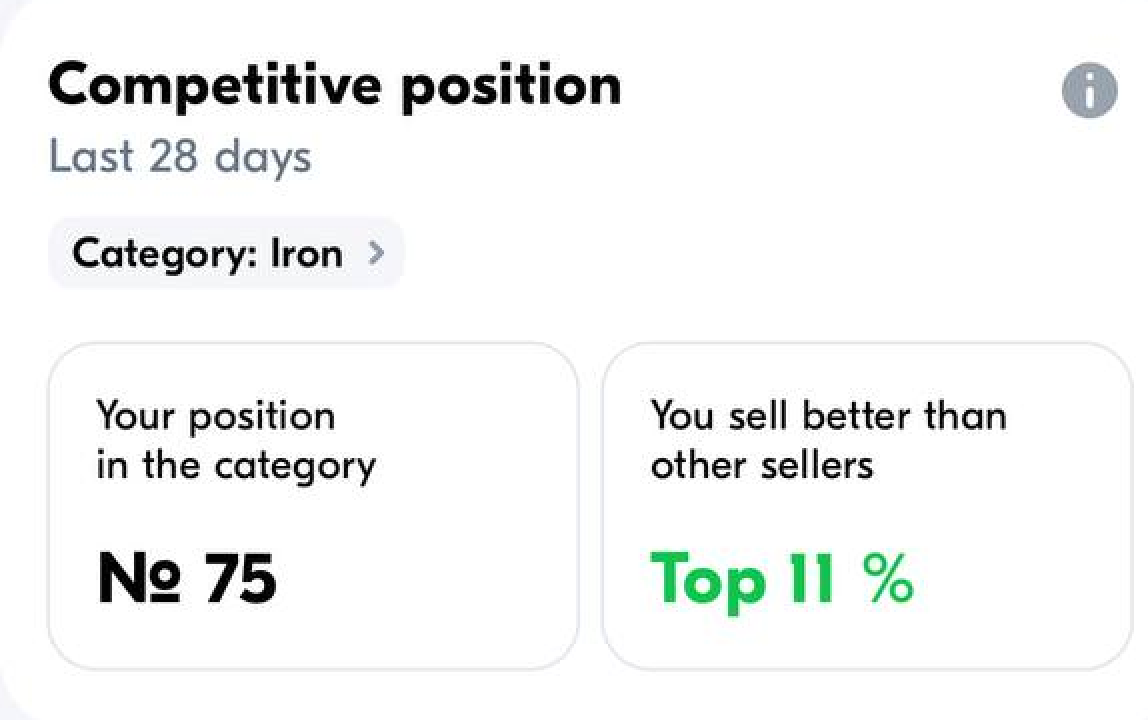
In the Competitive Position widget, you can view your sales position relative to other sellers in a specific category. You’ll see what place you take and what percentage of sellers you belong to.
The data is given for the last 28 days. By default, we show the third-level category in which you have the most sales.
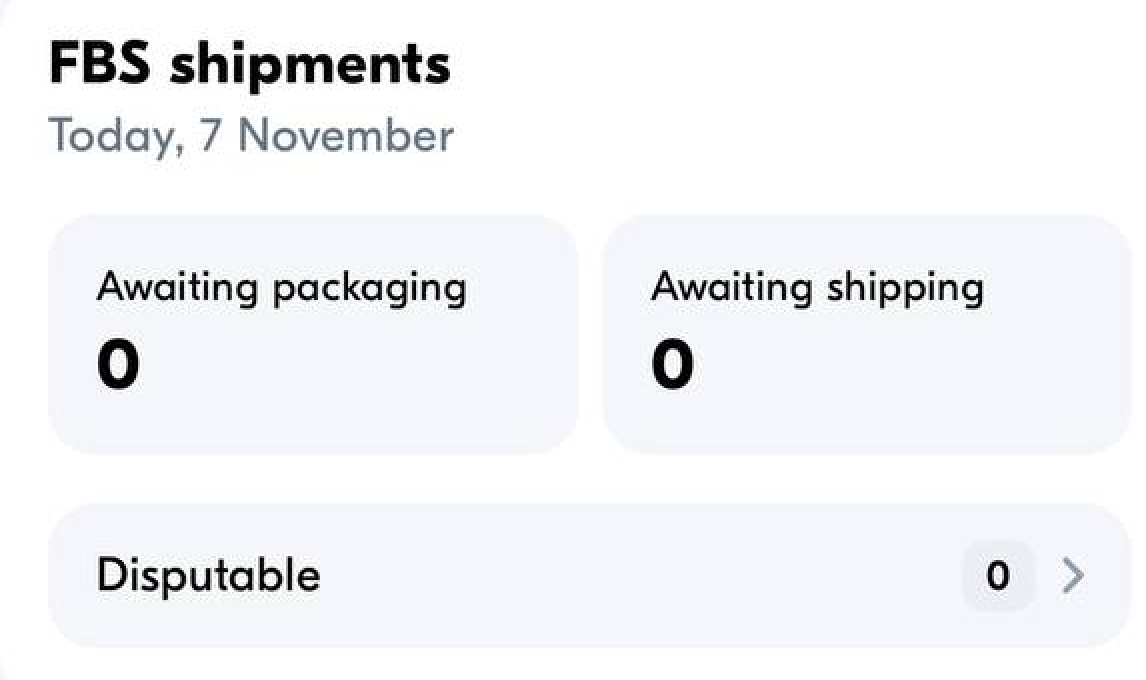
You can view the number of shipments in the last 14 days in the “Awaiting packaging”, “Awaiting shipment”, and “Disputed” statuses.
Hide menu
Show menu
Выберите договор

Это база знаний для продавцов из стран СНГ и дальнего зарубежья.
Если ваша компания зарегистрирована в России, перейдите в базу знаний для продавцов из России.
Когда вы зарегистрировались на Ozon?
Условия работы и инструкции зависят от даты заключения договора — её можно посмотреть в разделе Договоры
Определили ваш договор
Он заключён с ООО «Интернет Решения». Если есть другой договор, сможете переключиться на него в боковом меню