Определили ваш договор
Он заключён с ООО «Интернет Решения». Если есть другой договор, сможете переключиться на него в боковом меню
In the What to sell on Ozon → Query analytics section, you can view:
With the analytics data, you can:
We update the data daily.
Advanced analytics is available for sellers who already have an Ozon account.
Learn more about sales analytics
Ready-made list of the most popular search queries: contains top 1,000 queries for the last 7 days in all categories. We don’t make any changes to queries that users enter into the search bar on the site. For example, if the user enters the foreign brand name in Russian, we save this query in Russian.
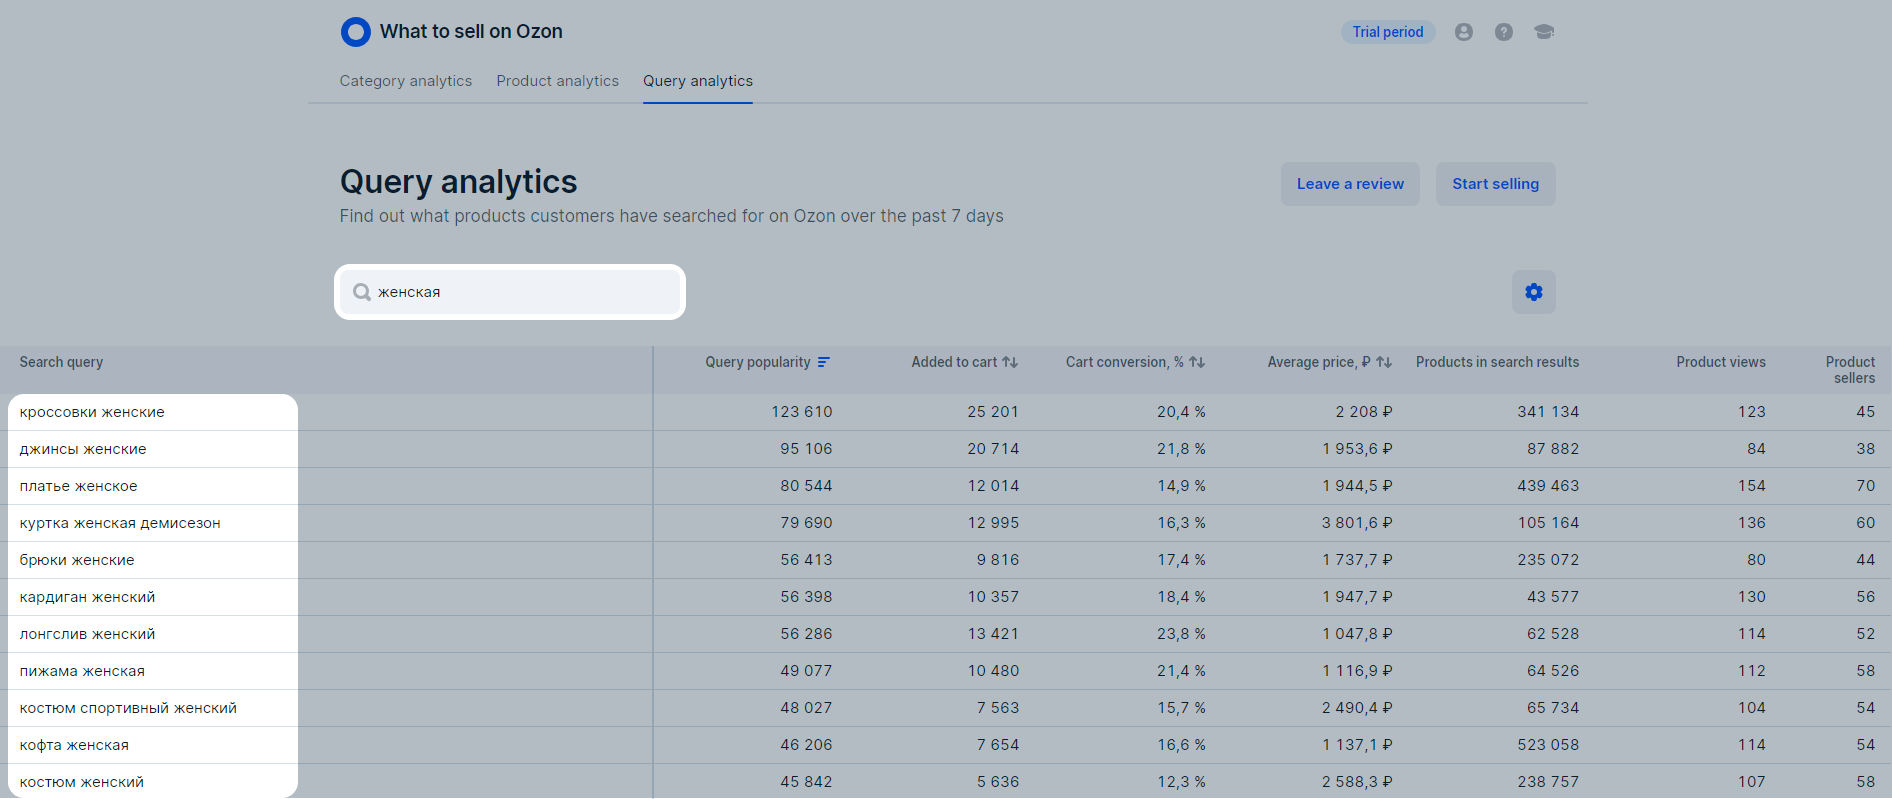
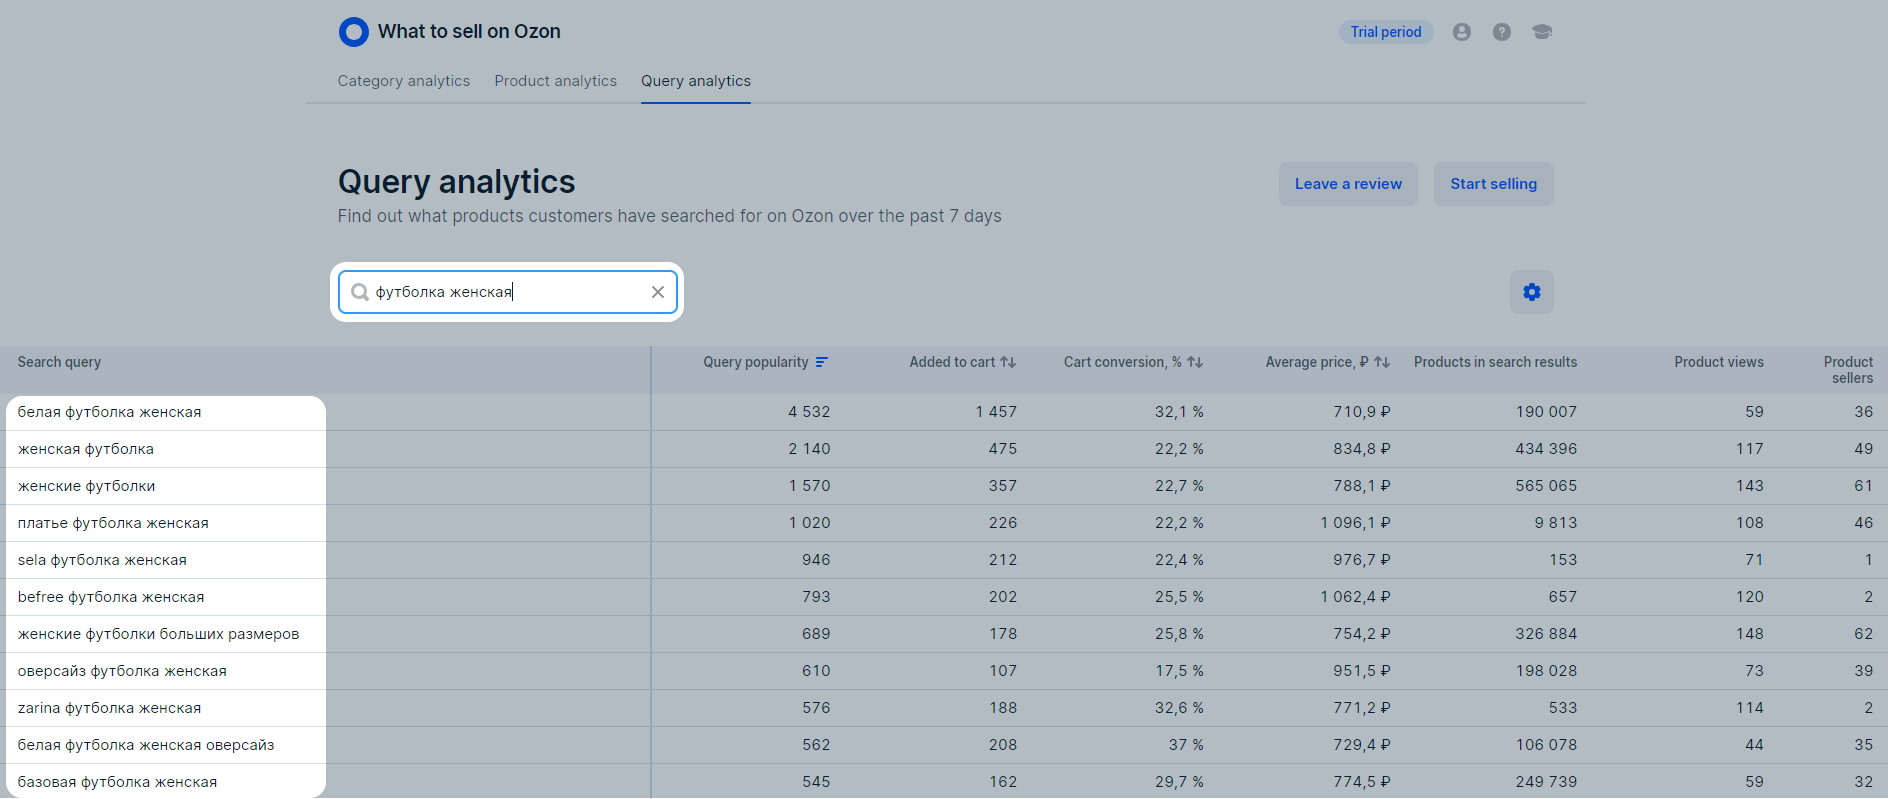
Search by queries: enter a query in the search bar to see a query selection by keywords.
Sorting by metrics: by default, we sort the list and search results according to the query popularity: from the most frequent to the rare ones. You can:
To customize the display of metrics in the table, click
![]() and enable or disable the display of the desired metrics.
and enable or disable the display of the desired metrics.
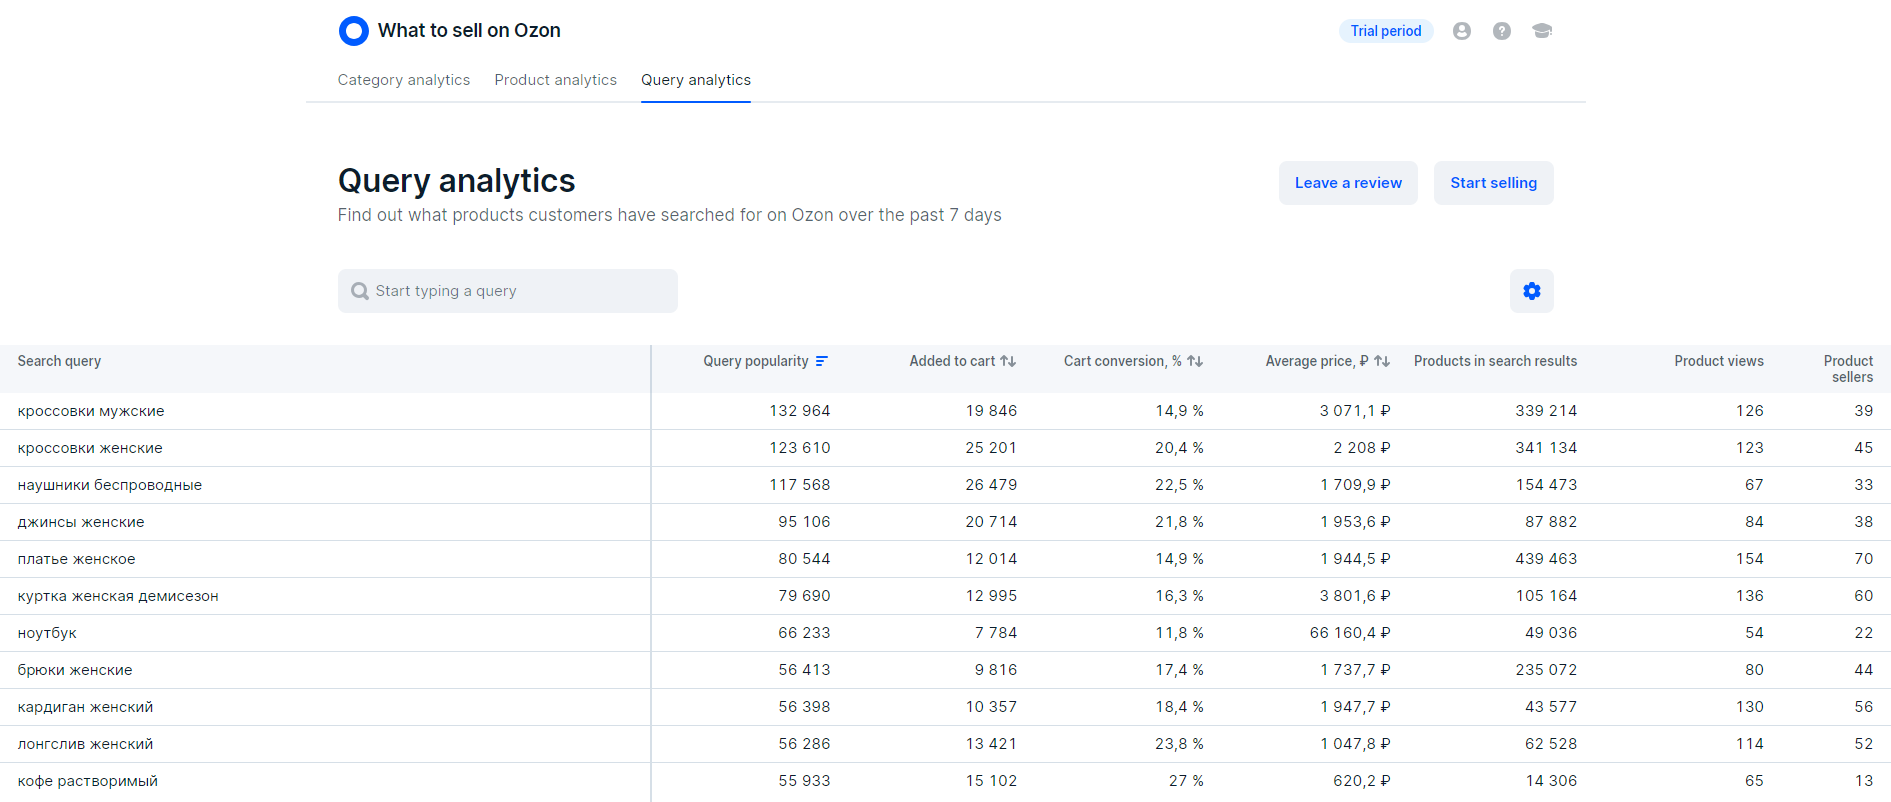
Check the list of the most popular queries or enter your own query in the search bar. Analyze metrics:
Query popularity: the number of unique customers who searched for a product using this query.
The more popular the query, the more likely it is to find your audience and get your first orders.
Product views: the number of unique customers who have opened the PDP from search results.
The lower the metric, the less often customers open PDPs. It may mean that in search results there are few suitable products with attractive PDPs, competitive price, and fast delivery.
Added to cart and Cart conversion, %: the number of customers who added at least one product to the cart from those found by the query. If a customer adds several products to the cart, we count it only once. This way you get the number of unique customers who are ready to place an order.
If the metrics have high values, it may mean that:
If the metrics have low values, it doesn’t mean that customers aren’t ready to buy the product. It may mean there are few suitable products at the top of search results, their PDPs are poorly filled, and the product has a low rating. Therefore, your sales can be influenced by product quality, delivery speed, PDP contents, and its promotion.
Products in search results and Product sellers: the average number of products and sellers that one customer views per query. The higher the values, the higher the competition in the category.
In the search bar, enter the name of the product you’re planning to sell. For example, “Women’s T-Shirt”.
The Average price column displays the average price of products that customers added to the cart from the search results by this query. When calculating the price, we take into account all products added to the cart, even if they’re added by one customer.
For example, two customers added three products to the cart. The first customer added one product for 500 RUB, the second one added two products for 1,000 and 1,200 RUB. The average cost equals to: (500 + 1,000 + 1,200) ÷ 3 = 900 RUB.
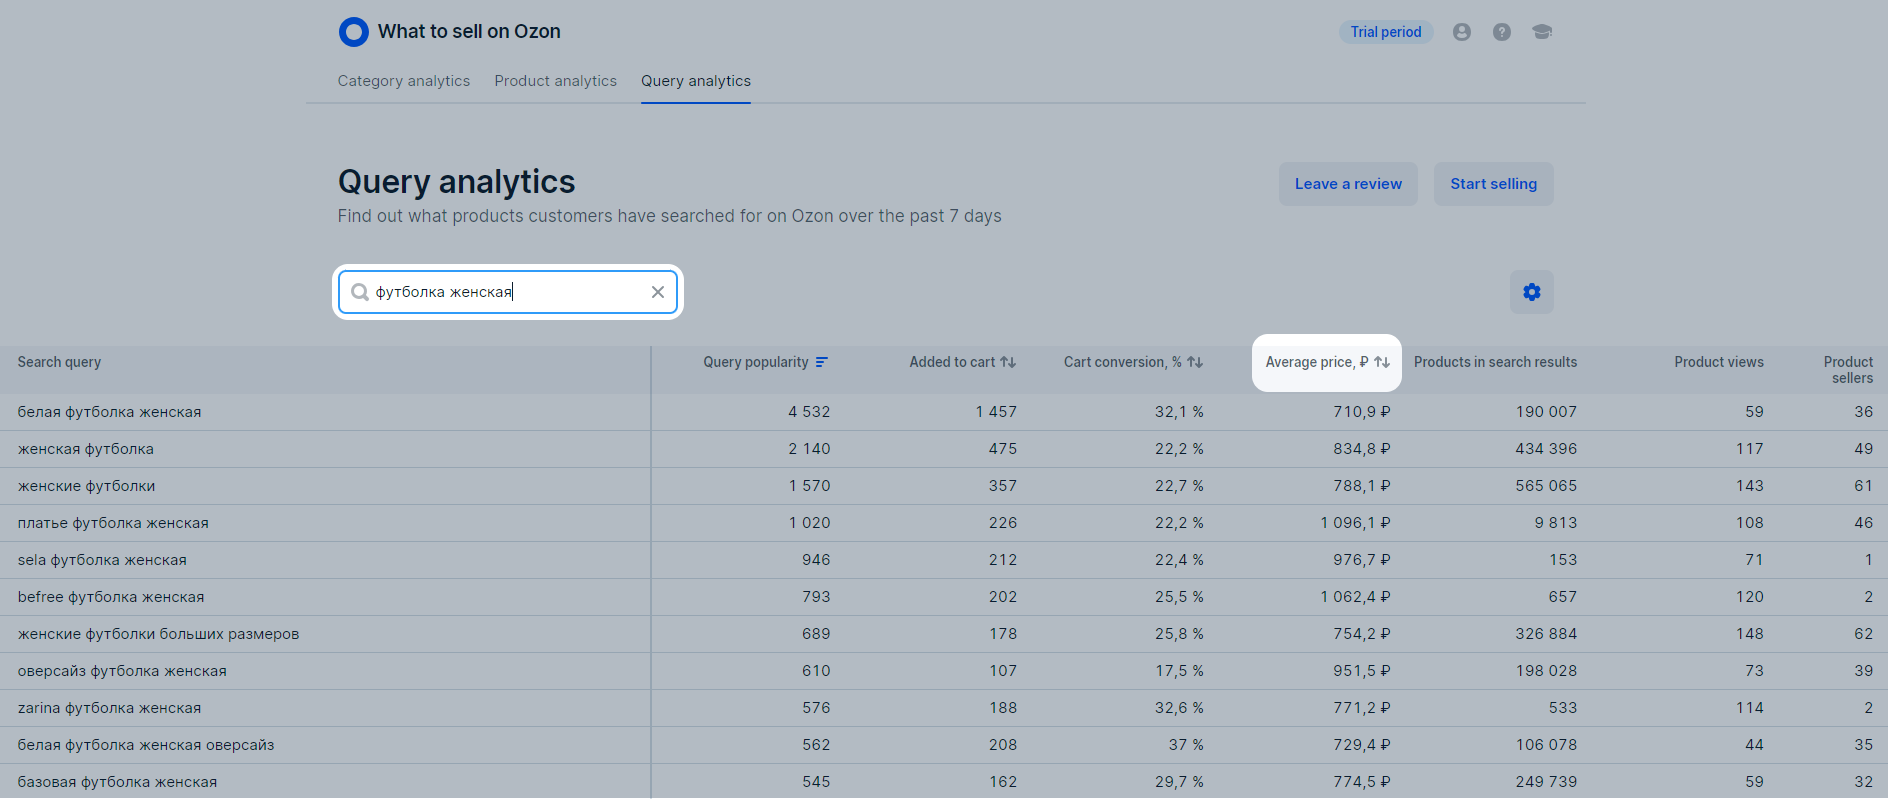
If you sell women’s clothing, you can find out which products customers search for more often. Enter the “Women’s” query in the search bar. The more detailed the query is, the more information about the product you receive. For example, if you enter the “Summer women’s dress” query, we show queries that contain specific models or materials.
In the search bar, enter the name of the product you’re planning to sell. For example, “Women’s T-Shirt”.
Among the popular queries, find the ones that match your product. For example, if you’re planning to sell oversized printed T-shirts and see such a query among the popular ones, you can add it to the PDP.
Hide menu
Show menu
Выберите договор

Это база знаний для продавцов из стран СНГ и дальнего зарубежья.
Если ваша компания зарегистрирована в России, перейдите в базу знаний для продавцов из России.
Когда вы зарегистрировались на Ozon?
Условия работы и инструкции зависят от даты заключения договора — её можно посмотреть в разделе Договоры
Определили ваш договор
Он заключён с ООО «Интернет Решения». Если есть другой договор, сможете переключиться на него в боковом меню