Определили ваш договор
Он заключён с ООО «Интернет Решения». Если есть другой договор, сможете переключиться на него в боковом меню
In the What to sell on Ozon → Product analytics section, you can view the list of products with the best sales on Ozon over the last 28 days. You can:
Advanced analytics is available for sellers who already have an Ozon account.
Learn more about sales analytics
The report contains:
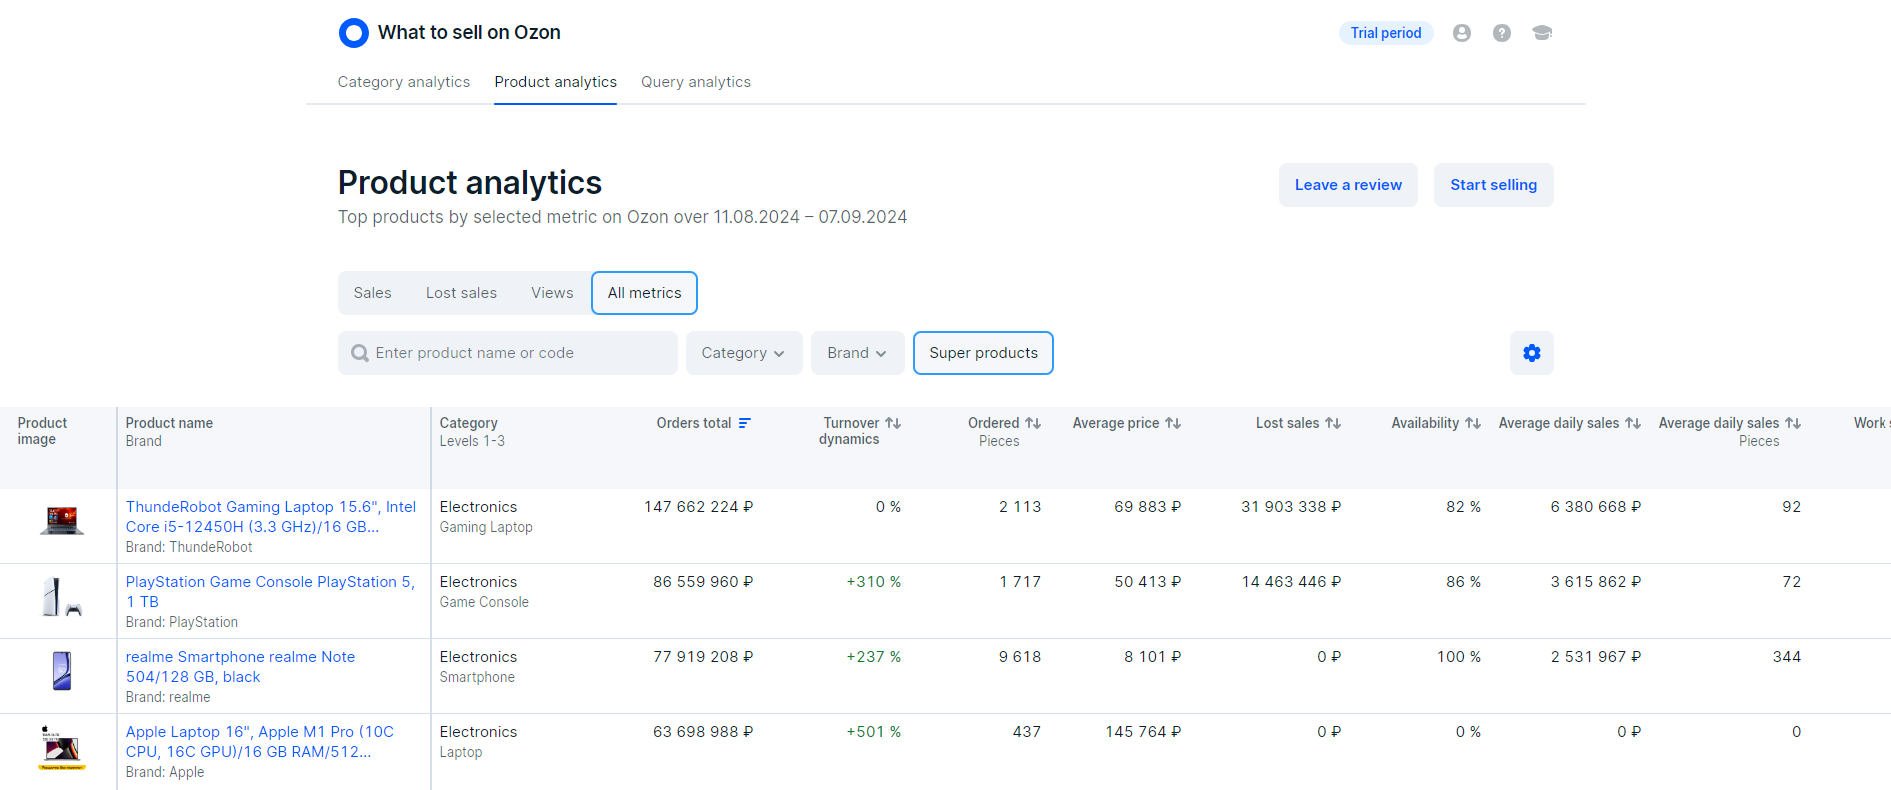
By default, we show the top 1,000 Super products in all sets of metrics. You can filter products by category, brand, or availability.
Super products are products that cost from 1,000 RUB, have high sales rates, and give sellers additional benefits on the marketplace.
To view the top 1,000 of all products, disable the Super products filter.
If the product is not on the list, it means that it had no sales for the period or didn’t get to the top of the best-selling products. We update the data daily, but with a 3-day delay. For example, on May 31, we show data from May 1 to May 28.
At the top of the list, there are products with high amount of lost sales. The higher it is, the greater the demand for the product.
To sort the list by one metric, in the table header click
![]() next to the name of the metric.
next to the name of the metric.
| Column name | Meaning |
|---|---|
| Product name and brand | To open the PDP on Ozon, click the product name. You can see the product brand if the seller has specified it on the PDP. |
| Сategory, levels 1–3 | Names of the product categories. |
| Orders total, ₽ | The total cost of the ordered products, including VAT. We calculate it for a period of 28 days. |
| Turnover dynamics, % | Change in the total cost of ordered products compared to the previous 28-day period. |
| Ordered, pieces | The number of products ordered over the last 28 days. |
| Average price, ₽ | Average selling price of the product, including VAT, over the last 28 days. |
| Lost sales, ₽ | Revenue that the seller could have received if the product had been in stock for the entire 28-day period. To calculate the metric, multiply the average daily amount of orders when the product was in stock by the number of days when the product was out of stock. |
| Availability, % | Part of the period when the product was in stock. For example, the product was in stock for 7 days out of 28, its availability would equal to 25%. We check the product availability every day at 02:00 Moscow time. |
| Average daily sales, ₽ | Average amount of orders per day (ADS). To calculate it, we divide the total sales amount for 28 days by the number of days when the product was in stock. We don’t deduct sales of returned and canceled products. |
| Average daily sales, pieces | Average number of orders per day. To calculate it, we divide the total number of orders for 28 days by the number of days when the product was in stock. |
| Work scheme | • realFBS: the seller processes, packages, and delivers orders by themselves, third-party services, or Ozon partner services; • From abroad: the seller is registered outside Russia and CIS countries. |
| Delivery time, days | The average delivery time to the customer for the last 28 days. |
| Product volume, l | Space that the product takes up. The larger the volume, the higher the cost of logistics and placement of products in the Ozon warehouse. |
| Search and catalog views | The number of customers who have seen the product in search results and catalog in the last 28 days. |
| PDP views | The number of customers who have opened the PDP in the last 28 days. |
| Added to cart from search and catalog | The number of customers who have added the product to the cart from the catalog or search results in the last 28 days. |
| Added to cart from the PDP | The number of customers who have added the product to the cart from the PDP in the last 28 days. |
| PDP creation date | Creation date of the PDP displayed in your account. |
To plan sales, pay attention to the cart conversion rate and the number of sessions. For example, if customers saw the product 2 times and added it to the cart both times, the conversion rate would equal to 100%. This result doesn’t indicate sales success, because the product was viewed and added to the cart only 2 times during the selected period.
To view a list of high-demand products sorted by the amount of lost sales, set up the Categories and Brands filters.
We show a list sorted by the number of lost sales. At the top of the list, there are products of a high-demand category or brand.
You can add high-demand products to your product range, even if they’re out of stock. This makes your store more attractive to customers. To find such products, in the Availability filter, select Out of stock. If you haven’t decided on a category to start selling on Ozon, set up only the availability filter and don’t select categories or brands. The list shows the out-of-stock products among the best-selling ones in all categories. If you plan to sell products of particular categories, select them in the Category filter. The list shows the out-of-stock best-selling products in these categories. If you plan to sell products of a specific brand, specify it in the Brand filter.
Select Conversion.
To view the best products in all categories, don’t use the Category and Brand filters.
The higher the Added to cart from search and catalog and Added to cart from PDP metrics, the more customers added the product to the cart from the PDP, search results or catalog.
To view the PDP on Ozon, click the product name.
Hide menu
Show menu
Выберите договор

Это база знаний для продавцов из стран СНГ и дальнего зарубежья.
Если ваша компания зарегистрирована в России, перейдите в базу знаний для продавцов из России.
Когда вы зарегистрировались на Ozon?
Условия работы и инструкции зависят от даты заключения договора — её можно посмотреть в разделе Договоры
Определили ваш договор
Он заключён с ООО «Интернет Решения». Если есть другой договор, сможете переключиться на него в боковом меню