View product stock
In the FBP → Stock management section, you can view detailed information on all products in stock at FBP warehouses to make timely decisions about product removal, campaign launch, or promotion setup. It helps reduce storage costs and increase stock liquidity.
In the stock table, you can view:
- Article code: the product identifier in your database.
- SKU: the product identifier in the Ozon system.
- Stock in warehouses: the product quantity in pieces as of the last update. We update the report once a day. The last update time is displayed in the table header. The ratio of the product quantity stored at a fee and for free is displayed using a color indicator.
- Free and For a fee: the quantity of products stored for free and at a fee as of the last update. We calculate storage days for each product batch, starting from the acceptance date. Products are shipped on a FIFO basis, so the first ones to arrive at the warehouse are shipped first. We highlight the products that require attention:
- It will become paid: the storage of at least one product piece becomes paid in the next 28 days. We show the data as of the last update.
- Soon it will become a paid service: the storage of at least one product piece becomes paid in the next 14 days. We show the data as of the last update.
- Start of paid storage: the date when the storage of at least one product piece becomes paid, and the number of days until the start of paid storage. If at least one piece is stored on a paid basis, a “—” symbol appears in its row.
- PDP views: the number of visits to the PDP over the past 28 days. We display the “Few views” hint if the number of views is lower than the average for similar products in the category.
- PDP view-to-cart conversion: the ratio of sales to views over the past 28 days. We display the “Few views” hint if the number of views is below the average for similar products in the category.
- Number of sales: the number of product pieces sold over 28 days and the sales dynamics in % compared to the previous 28 days. We highlight it:
- in red if sales dropped;
- in green if sales increased;
- in gray if sales didn’t change.
- Days until the end of the remaining stock: the number of days left until the current product stock is sold out, based on average sales over the last 28 days (IDC). We recommend removing products that are on sale for a long time and are stored at a fee.
- Price index: shows how attractive your prices are to customers compared to your competitors.
Learn more about the price index
- Recommendation: tips to increase stock liquidity and boost sales. Possible recommendations:
 : add the product to a promotion. We recommend it if the product conversion rate is low or its price index is unfavorable.
 : set up product promotion. We recommend it if the product has few views.
 : create a removal request. We recommend it if the product stock lasts more than 90 days based on average daily sales.
Click  to open the table settings and select which columns to display in the report.
To view data only for a specific storage type, select it in the filter above the table.
The same product can appear in the table under both For a fee and Free types. This means that part of the stock is stored for free, while for another part the free storage period is over.
You can:
- find products by their name, article code, or SKU;
- filter products by free storage period, views, conversion rate, price index, and recommendations.
To view the product warehouse location, to the left of the product line click  .
.
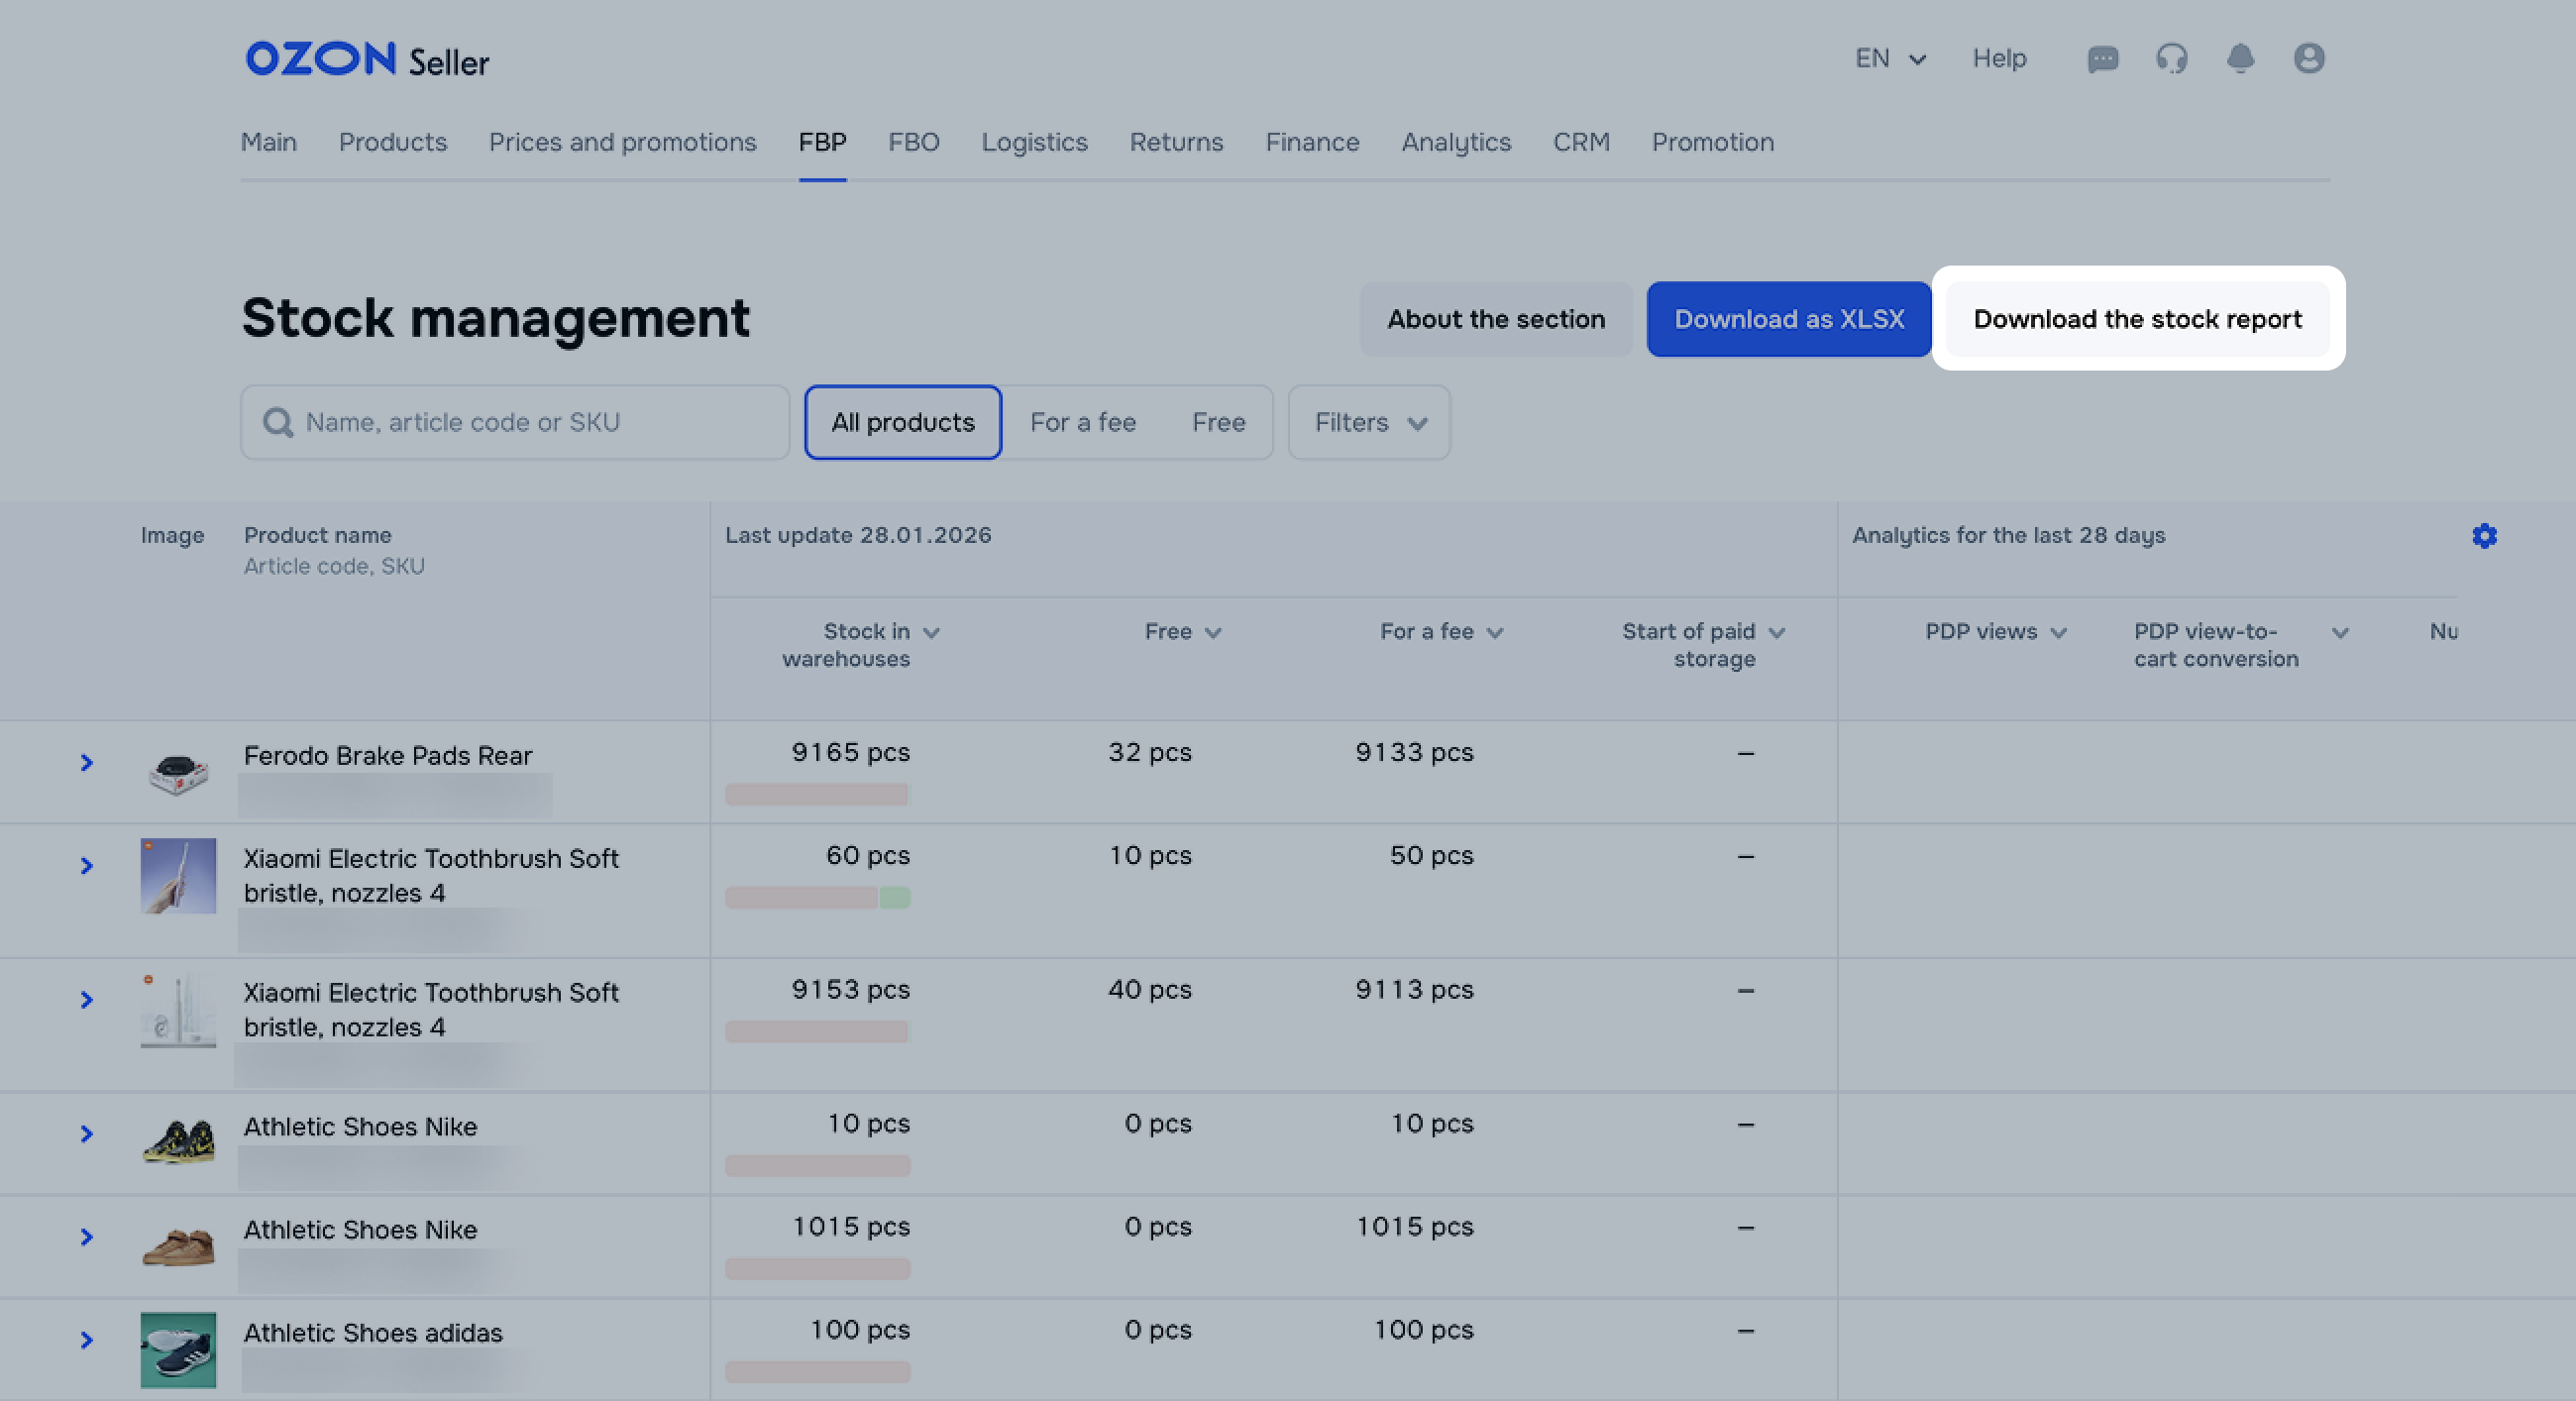
To download the table, click Download as XLSX. You get the table containing all products, with no filters.
Download stock report
To download the report, click Download the stock report. It’s generated for all warehouses in XLSX.
The report contains:
- SKU: product identifier on Ozon.
- Warehouse name: the warehouse where the product is stored.
- Article number: product identifier in your database.
- Product name: product name on the PDP.
- Available for sale goods: number of products available for sale on Ozon at the time you download the report.
- Reserve: number of products reserved for shipping from the warehouse.