Определили ваш договор
Он заключён с ООО «Интернет Решения». Если есть другой договор, сможете переключиться на него в боковом меню
Monitoring analytics helps you assess if the promotion tools you’re using are effective, and promptly react to changes in metrics. You can view the data on the promotion of specific products or categories for the period:
Open the Promotion → Promotion analytics section.
Select the time period for which you want to view the analytics. The maximum period is 90 days.
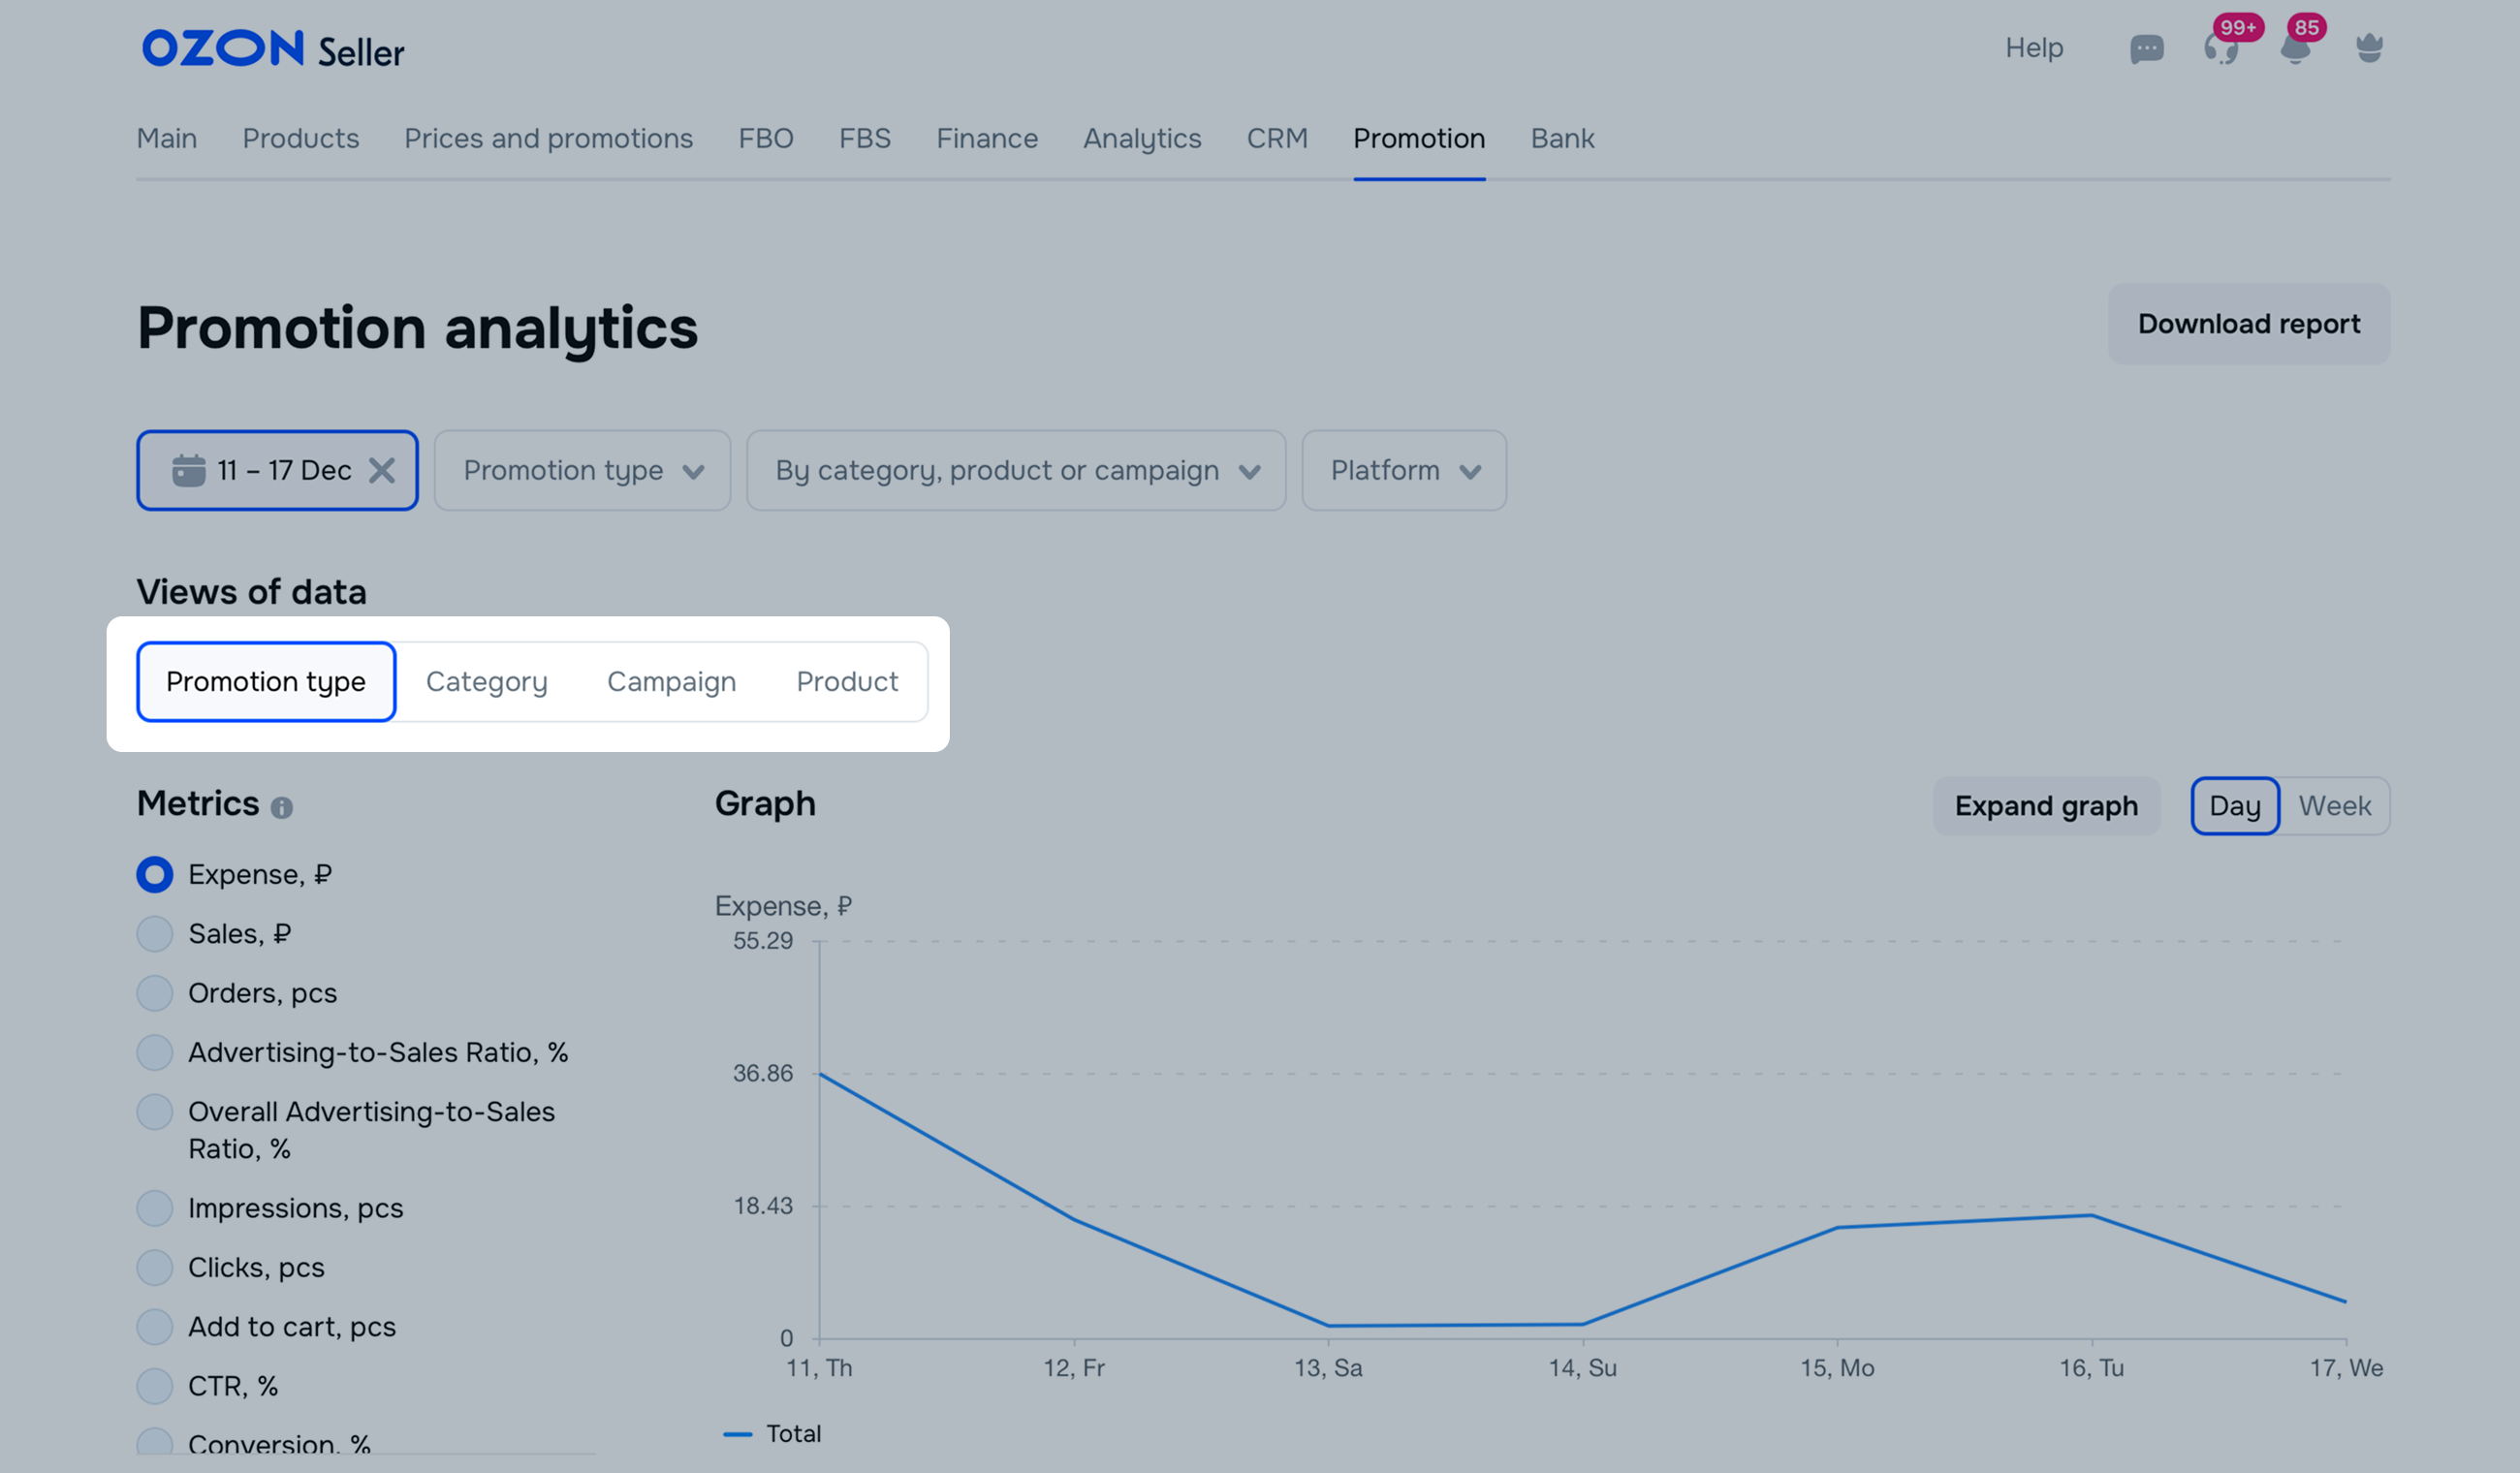
Select the promotion type:
You can choose several promotion tools or all of them.
Filter the data by category, product, or campaign.
You can switch between data views by promotion type, category and subcategory, campaign, or specific product. In a product data view, in addition to the promoted product, you can view data on sales and orders for models from the merged PDP.
We show the promotion data for the selected period.
To view sales and orders for all models in the merged PDP of the promoted product, click
![]() next to it on the Product data view.
next to it on the Product data view.
To view data on promoted products only, merged models excluded, select Only products in promotion filter.
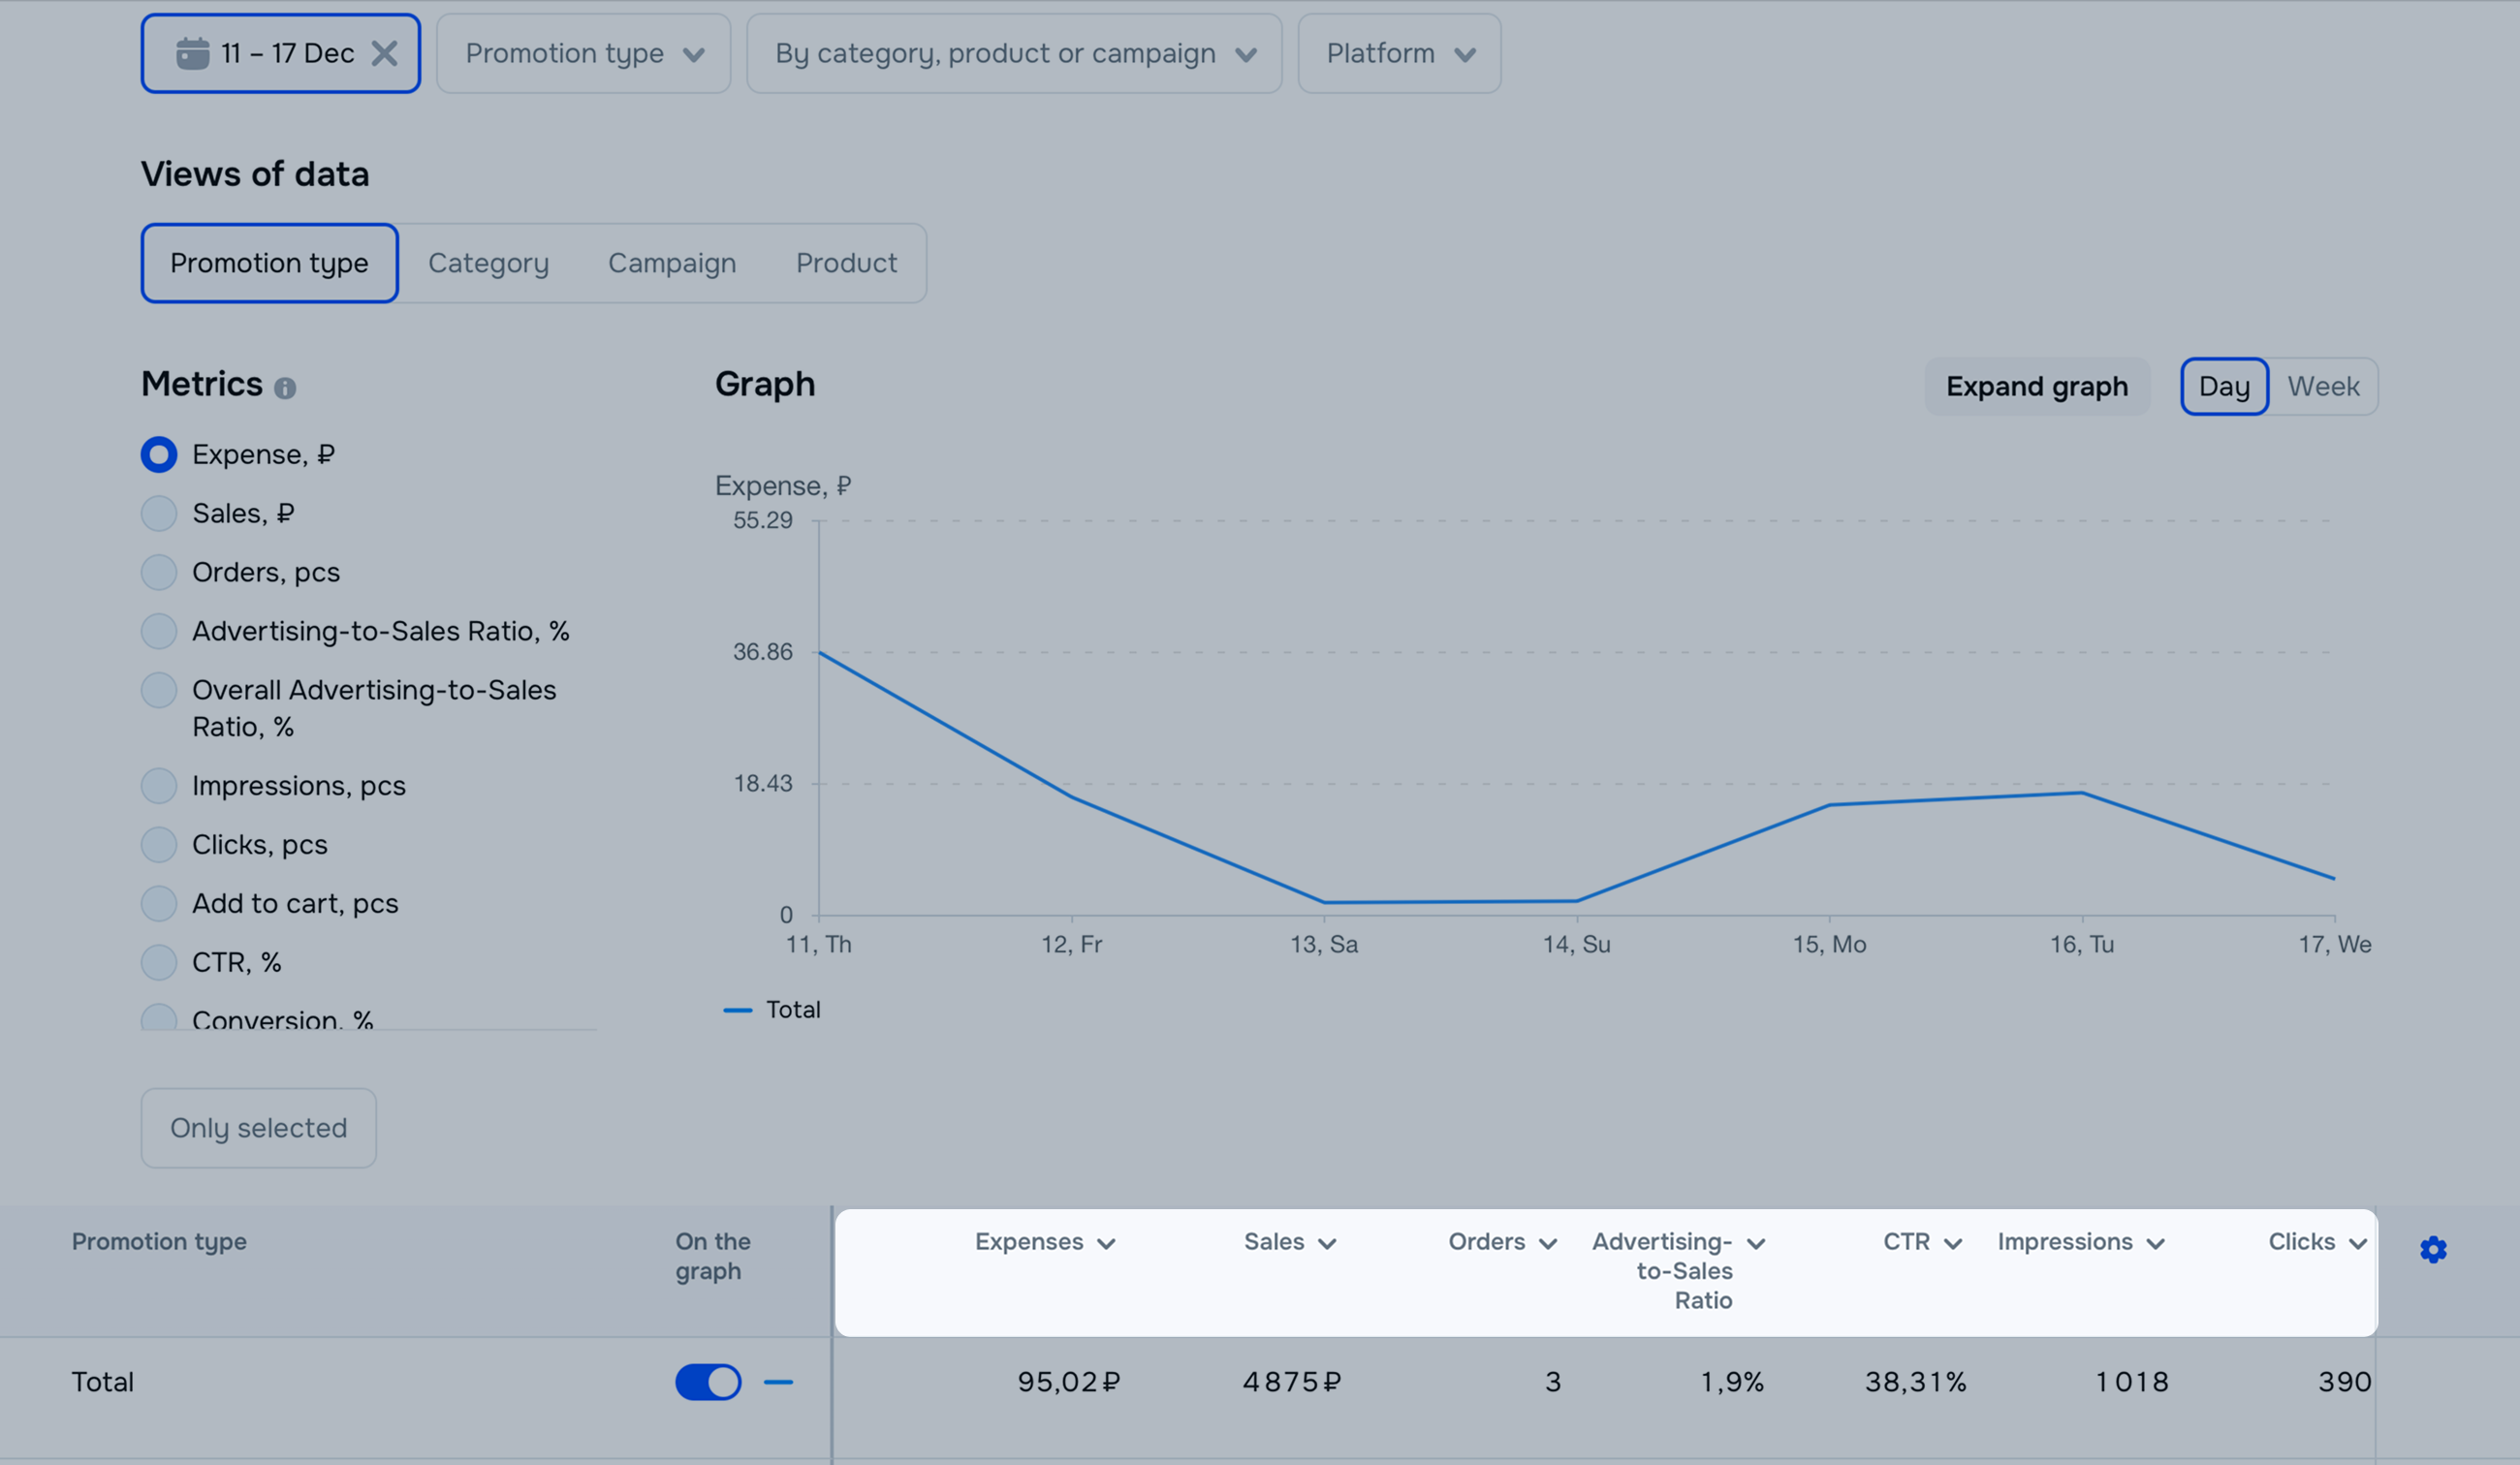
To view metrics on the graph, switch between metrics:
To view the graph in full-screen mode, click Expand graph.
The analytics can be displayed on the graph by days or weeks.
If you want to compare the data on the graph, select the desired products in the On the graph column. You can select a maximum of 10 products for comparison.
If during the selected period you simultaneously promoted the product in pay-per-order and pay-per-click campaigns, we show:
Expense (Pay-per-order): total cost of product promotion with pay-per-order. It makes up a specific percentage of the price of products sold.
Expense (Pay-per-click): total cost of product promotion with pay-per-click campaigns. It makes up a specific percentage of the price of products sold.
Sales (Pay-per-order): total order amount as a result of pay-per-order campaigns.
Sales (Pay-per-click campaigns): total order amount as a result of pay-per-click campaigns.
Orders (Pay-per-order): total number of orders received as a result of pay-per-order campaigns.
Orders (Pay-per-click campaigns): total number of orders received as a result of pay-per-click campaigns.
Advertising-to-sales ratio: the share of promotion expenses from total sales amount you got by promoting products with pay-per-order.
To download the data in XLSX format, click Download report.
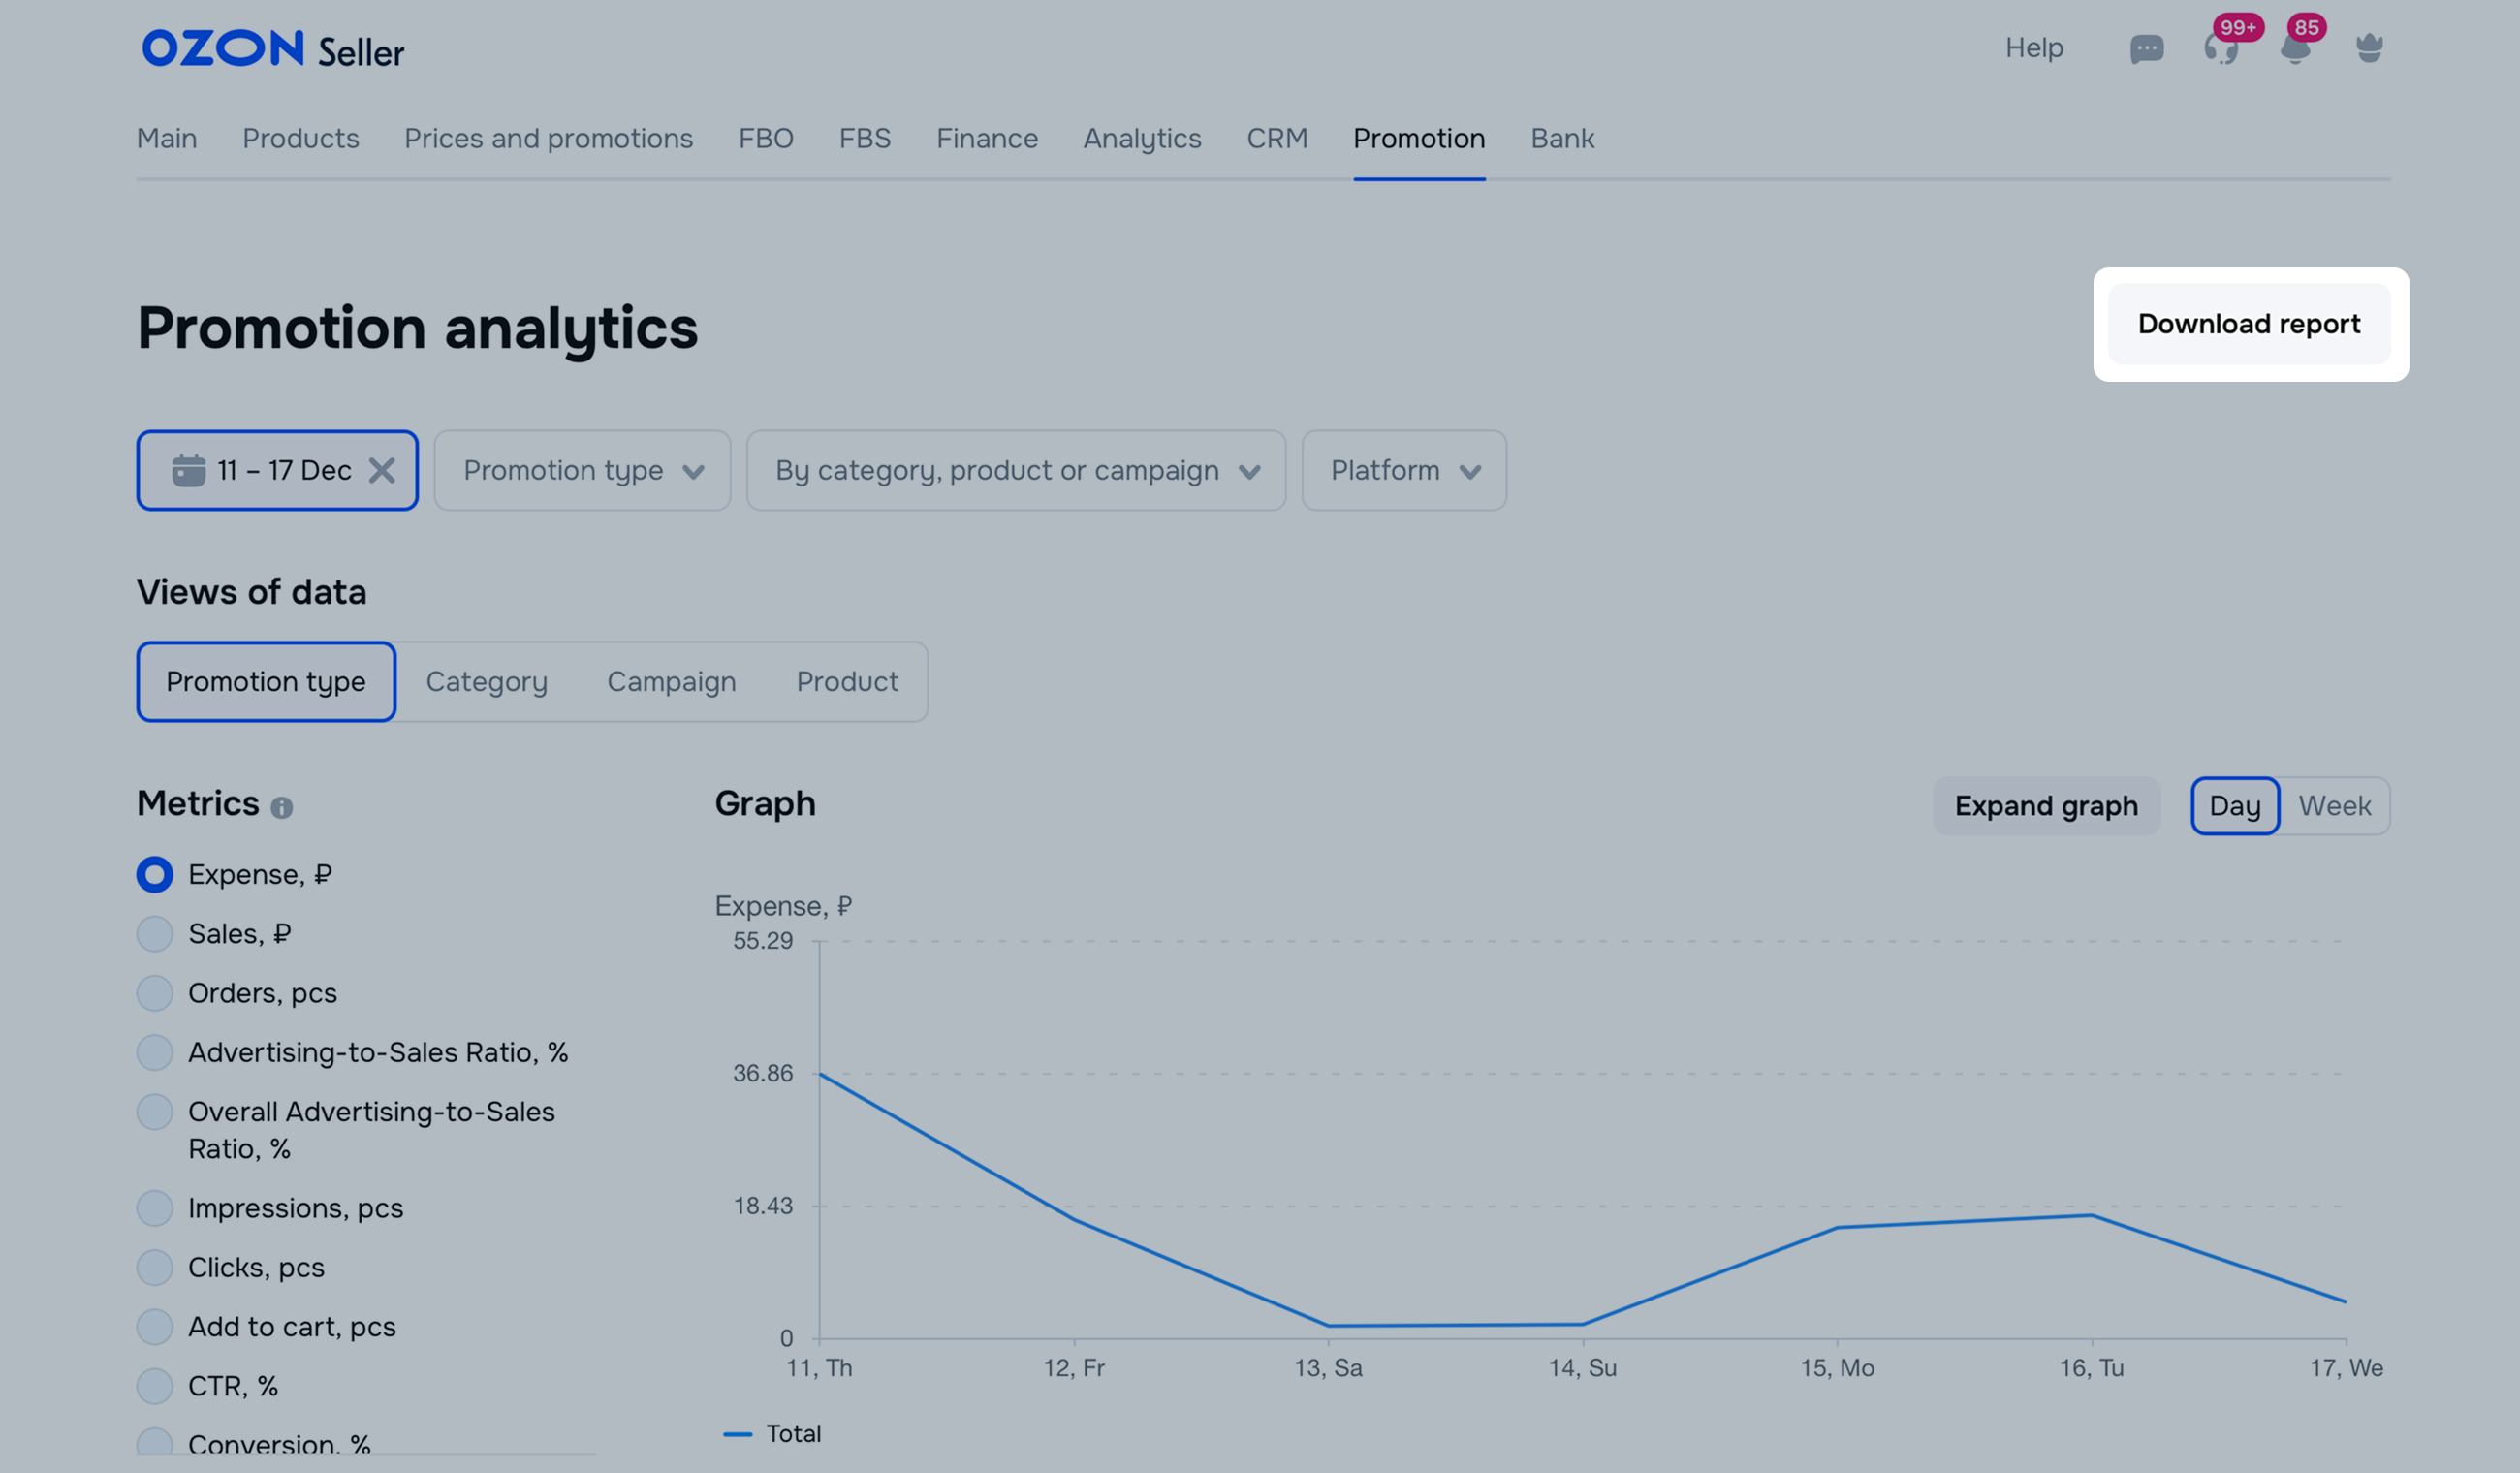
There are two tabs in the file:
Hide menu
Show menu
Выберите договор

Это база знаний для продавцов из стран СНГ и дальнего зарубежья.
Если ваша компания зарегистрирована в России, перейдите в базу знаний для продавцов из России.
Когда вы зарегистрировались на Ozon?
Условия работы и инструкции зависят от даты заключения договора — её можно посмотреть в разделе Договоры
Определили ваш договор
Он заключён с ООО «Интернет Решения». Если есть другой договор, сможете переключиться на него в боковом меню